CFO Corner / Categories:  Operations
 Strategy
2024-05-06 | 9 min read


14 KPIs SaaS businesses should be tracking
If there’s one certain thing about growing a business, is that data and Key Performance Indicators (KPIs) are crucial to measure an organisation’s progress and drive business success.
In a time where a path to sustainable profitability is more important than ever, and growth is no longer enough to impress investors, SaaS businesses must rely heavily on data to identify patterns and areas for improvement.
Intuition still has value, but tracking the right SaaS metrics is key to making informed decisions. By regularly monitoring KPIs, business leaders can easily identify and immediately act on areas of improvement, making the necessary adjustments to ensure sustainable growth.
Why SaaS businesses track specific KPIs
Knowing which metrics to track is different for every business. SaaS businesses operate in a subscription-based model, so the KPIs they track should reflect aspects of the business such as customer acquisition, revenue growth, and churn rate. These figures provide insights into the health and performance of SaaS operations. What sets them apart from other businesses is, essentially, the customer journey.
A business selling a product in a traditional setting, shows it to the customer, who asks additional questions. They agree on a price and complete the transaction — and that’s the end of the story. For a successful SaaS business, that’s just the prologue, as it hinges on understanding customer behaviour throughout their journey.
For instance, metrics such as Customer Acquisition Cost (CAC) help identify the most efficient channels for acquiring new customers, leading to smarter marketing efforts and ditching ineffective strategies. Other KPIs, like Monthly Recurring Revenue (MRR) or Customer Lifetime Value (LTV), provide SaaS companies with actionable insights into their financial health and scalability.
SaaS businesses operate in a subscription-based model, so the KPIs they track should reflect key aspects of the business such as customer acquisition, revenue growth, and churn rate.
Additionally, KPIs related to customer satisfaction, such as Net Promoter Score (NPS) and Customer Churn Rate, help SaaS businesses gauge the effectiveness of their products and services in meeting customer needs.
By tracking these specific KPIs, SaaS companies can identify areas of strength and weakness, prioritise strategic initiatives, and drive sustainable growth in a competitive market landscape.
SaaS KPIs to track in 2024
ARR
ARR stands for Annual Recurring Revenue and is a critical metric for SaaS businesses. It represents the predictable and recurring revenue a company is expected to generate from the contracts of its subscription-based products over a 12-month period.
It’s typically the north star for SaaS businesses as it provides insights into a company’s financial health and growth. It’s also a key performance indicator for investors, stakeholders and executives.
Tracking ARR allows SaaS companies to monitor revenue growth and assess the impact of customer churn and expansion efforts. It also provides a standard metric for comparing the financial performance of SaaS businesses.
All subscription-based revenue streams should be considered in the calculation, including monthly, quarterly, or annual subscriptions, as well as any upsells, cross-sells, or add-ons. Any one-time or non-recurring revenue, such as setup fees, professional services, or one-off product sales, should be excluded from the calculation.
MRR
MRR is similar to ARR but refers to Monthly Recurring Revenue. The difference between the two is just the timeframe. ARR is the annualised version of MRR.
So, when should you use one or the other? MRR is often used as a revenue metric for early-stage businesses and when the typical contract is renewed on a monthly basis. ARR is preferred when the business is more mature and the contracts are yearly or multi-year.
Cash
Cash is to the total amount of money a business has available to use at any given time. This includes the cash in bank accounts, petty cash reserves, and any accessible marketable securities that can easily be converted into cash. As a KPI, it’s a direct way to measure the company’s capacity to finance its daily operations without additional funding.
It becomes even more important for SaaS companies that work with recurring revenue models. Creating a great product and seeing the return on the investment made to develop and put it on the market is not something that happens overnight, so it’s crucial for organisations to stay aware of their cash reserves.
Sales Velocity
A less known KPI for SaaS companies is sales velocity. Simply put, sales velocity measures your ability to generate new revenue, and it’s an essential piece of data for business leaders and investors. You calculate it by multiplying the number of opportunities by the average deal value and the win rate, then dividing it by the sales cycle length.
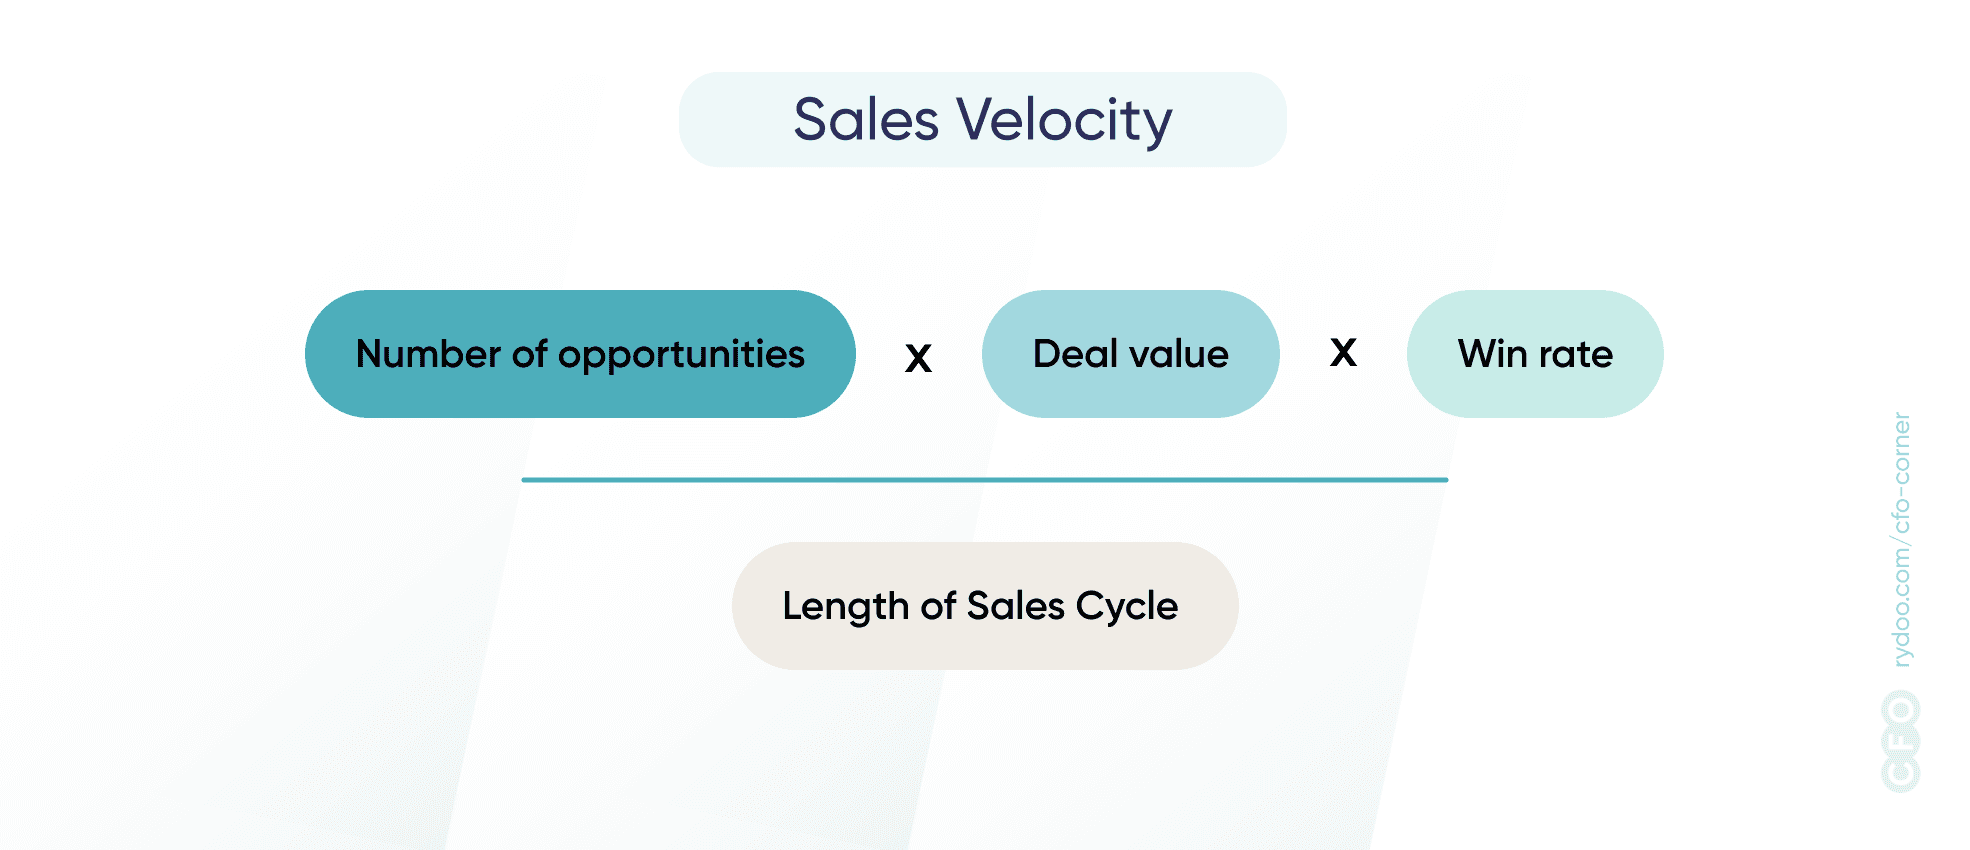
This KPI reflects the overall effectiveness of the GTM team and allows them to determine how much revenue they can expect to generate over a specific period of time.
NRR
NRR means Net Revenue Retention and it measures the percentage of recurring revenue retained from existing customers in a given period. This includes adjustments for downgrades, cancellations, and churn, but it also accounts for revenue gained from expansions and upgrades by existing customers. Revenue from new customers is excluded from this formula.
Measuring Net Revenue Retention (NRR) helps SaaS companies understand customer satisfaction and loyalty and the effectiveness of the teams’ upselling and cross-selling strategies. It’s also a way to predict long-term revenue stability, as it’s not dependent on new customer acquisition, and help the customer success team identify its strengths and weaknesses so they can work on their initiatives to reduce churn.
It’s especially important for investors, as a high NRR indicates that the company retains its customers and successfully increases its value over time.
CAC
CAC stands for Customer Acquisition Cost. It calculates the total cost of acquiring a new customer, which includes all sales and marketing expenses over a specific period. It’s calculated by dividing the total acquisition costs by the number of new customers gained during that period and is essential for evaluating the efficiency of a company’s marketing efforts and the sustainability of its growth.
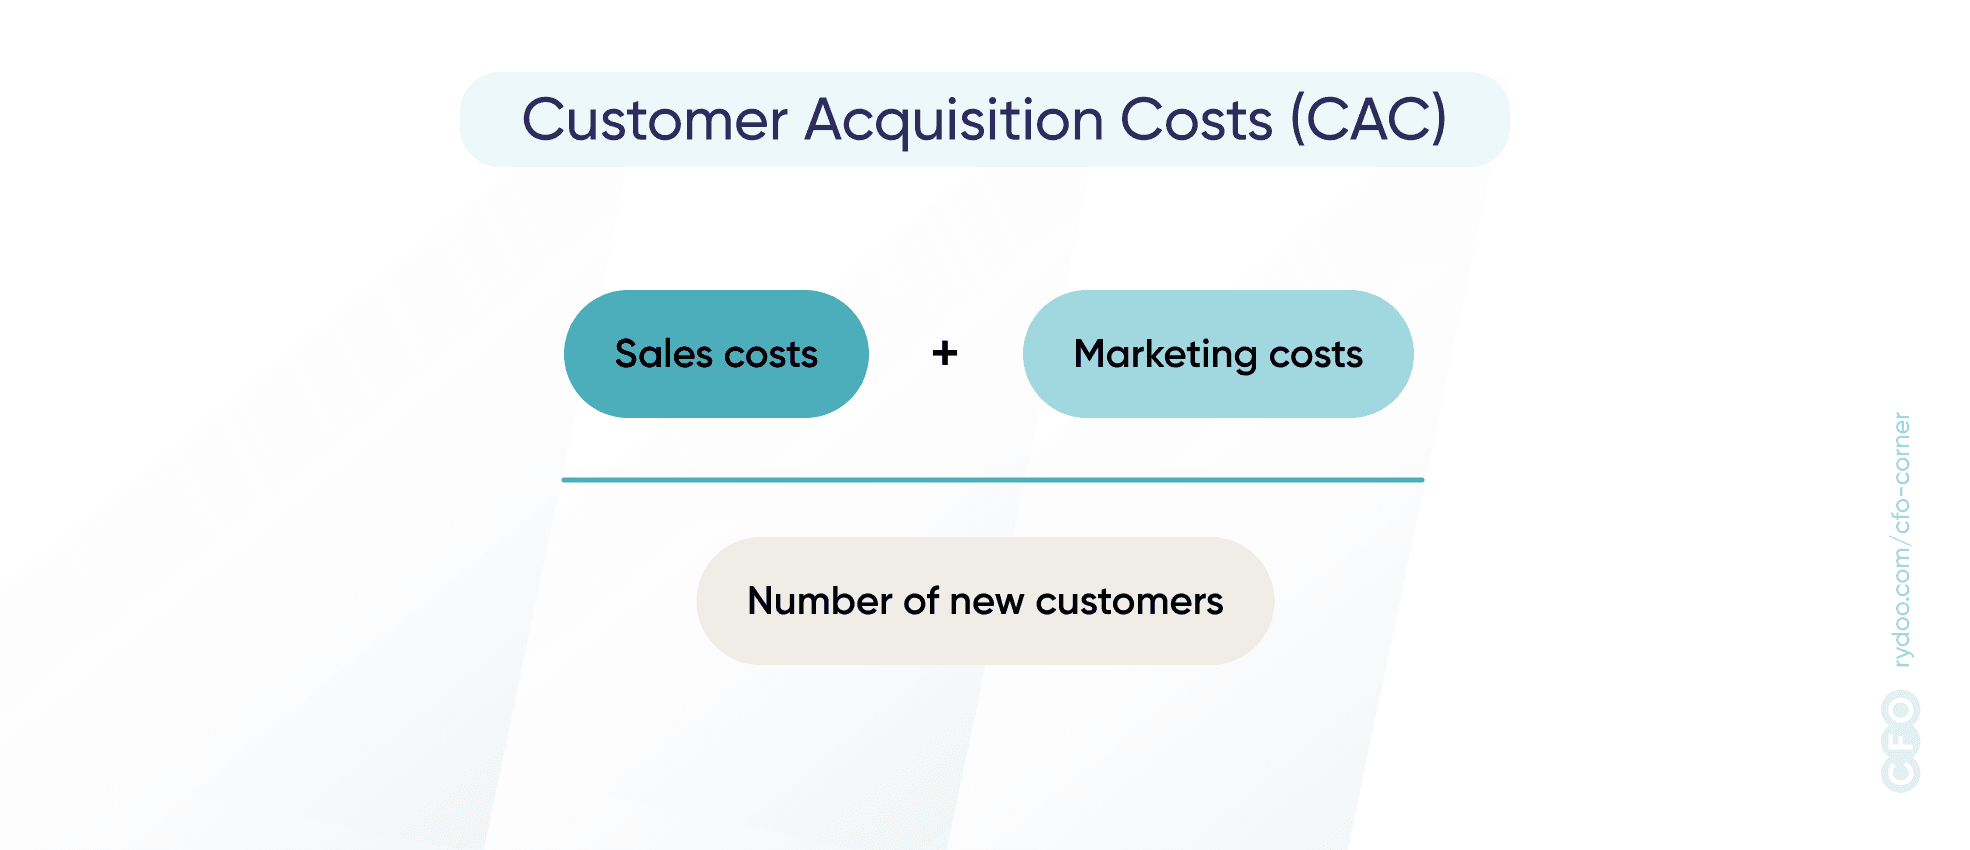
By continuously assessing these figures, organisations can determine whether GTM strategies are cost-effective and achieve a good return on investment. This allows for better strategic planning and budget allocation, influencing market expansion, product development, and customer relationship management.
LTV
Lifetime Value — also referred to as Customer Lifetime Value — estimates the total revenue a company can expect to generate from a customer throughout their entire relationship. It factors in the average revenue per user (ARPU) and the average customer lifespan (subscription length), providing a clear view of each customer’s expected financial contribution.
LTV enables multiple teams to make more informed strategic decisions. It helps determine the appropriate amount to spend on customer acquisition (it shouldn’t exceed what they’re expected to bring in), understand what the most profitable segments are, and it can even lead the product team to improve the product in order to guarantee longer-term commitments.
CAC:LTV Ratio
This ratio compares the cost of acquiring a new customer (CAC) to the expected total revenue they will generate throughout the relationship (LTV). It’s calculated by dividing LTV by CAC. It provides a clear financial measure of the return on investment in acquiring new customers.
The CAC:LTV ratio is important for assessing a business’s long-term sustainability. It provides a straightforward measure of the ROI of marketing and sales efforts, indicates if the business model is scalable, guides resource allocation, helps identify potential risks in growth strategies, and, thus, influences strategic decisions.
A healthy ratio indicates a scalable business model in which customer acquisition costs are justified by the revenue they generate.
Churn Rate
The churn rate is the percentage of customers who cancel or don’t renew their subscriptions or contracts within a certain time frame. To obtain this percentage, divide the number of customers lost during the period by the total number of customers at the beginning of the period, then multiply the result by 100.
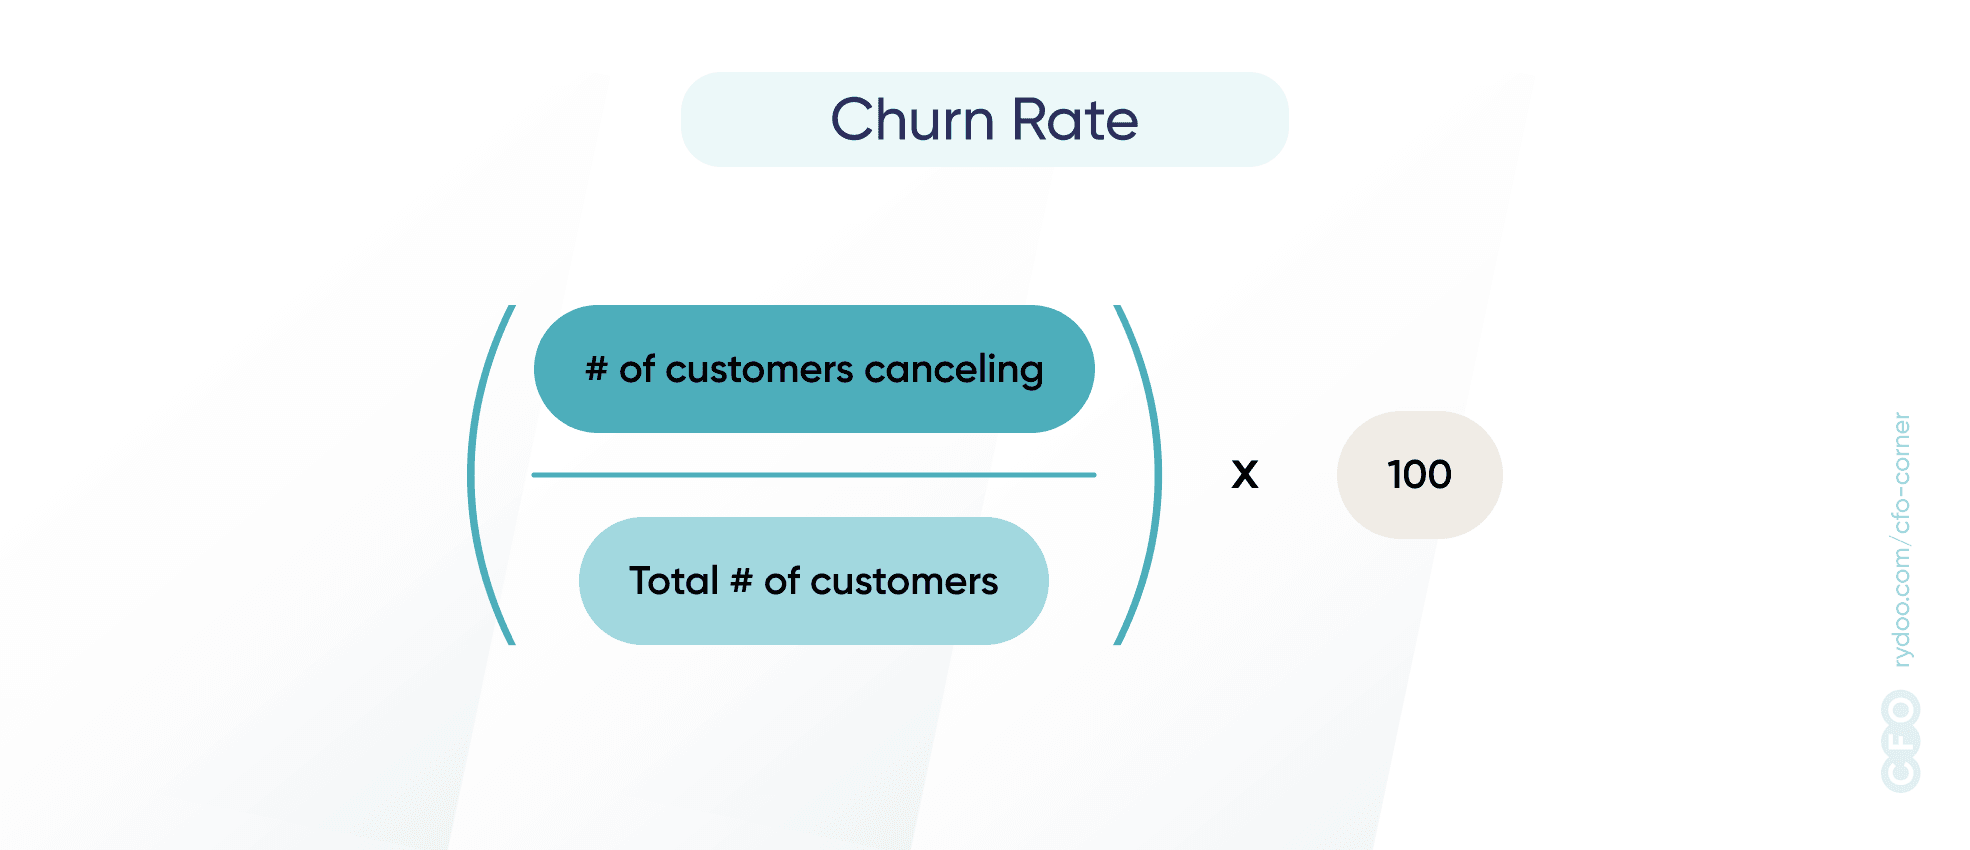
It’s a critical metric to assess customer retention and satisfaction with a business’s product or service. It also provides insights into the customer experience and the long-term viability of a business’s revenue model, as high customer retention rates directly contribute to sustainable revenue streams.
A low churn rate suggests high customer satisfaction and loyalty, which are vital for sustained revenue and growth. Monitoring churn and clearly understanding why customers are no longer interested in their services helps companies identify and address underlying issues before they impact a larger portion of the customer base.
NPS
NPS, short for Net Promoter Score, measures customer satisfaction and loyalty, calculated based on customers’ likelihood to recommend a company’s product or service to others. It’s derived from customer responses on a scale of 0-10. Based on their ratings, customers are classified as Promoters (9-10 score), Passives (7-8 score), or Detractors (0-6 score). The final NPS is calculated by subtracting the Detractor’s percentage from the Promoter’s percentage.
This metric offers direct insight into customer perception and loyalty, serving as a leading indicator of future growth potential and customer retention. Businesses can compare this percentage against competitors and clearly identify areas for improvement.
ARR per Employee
The ARR per Employee is a productivity and efficiency metric that divides the company’s ARR by the total number of employees. It shows how much each employee contributes to the company annually.
A low APE indicates less revenue per employee, suggesting areas for improvement, while a higher figure indicates an efficient operation and effective use of resources, which is key for scalability and profitability. These numbers can help make informed decisions about hiring, training, and allocating other resources.
It also helps with benchmarking, as comparing performance with competitors’ can highlight strengths and areas for improvement.
eNPS
Aside from calculating the revenue employees generate, it’s also important for business leaders in SaaS to track employee satisfaction by measuring the Employee Net Promoter Score (eNPS). A high eNPS translates into long-term success and allows a business to push itself forward, as its employees are motivated, engaged, and happy to work for the teams’ common goals.
Motivation is key, and maintaining happy employees avoids turnover, which in turn saves costs on recruiting and training new employees. It also positively impacts the company’s brand, as engaged employees are often the biggest advocates for the organisation.
By keeping track of eNPS, leaders can quickly act on their employees’ pain points and open communication channels to cater to their needs, keeping their motivation and performance in the workplace.
Rule of 40
The Rule of 40 is a benchmarking framework, suggesting that a company’s growth rate plus its profit margin should equal or exceed 40%. For SaaS companies, this often combines revenue growth rate with EBITDA margin.
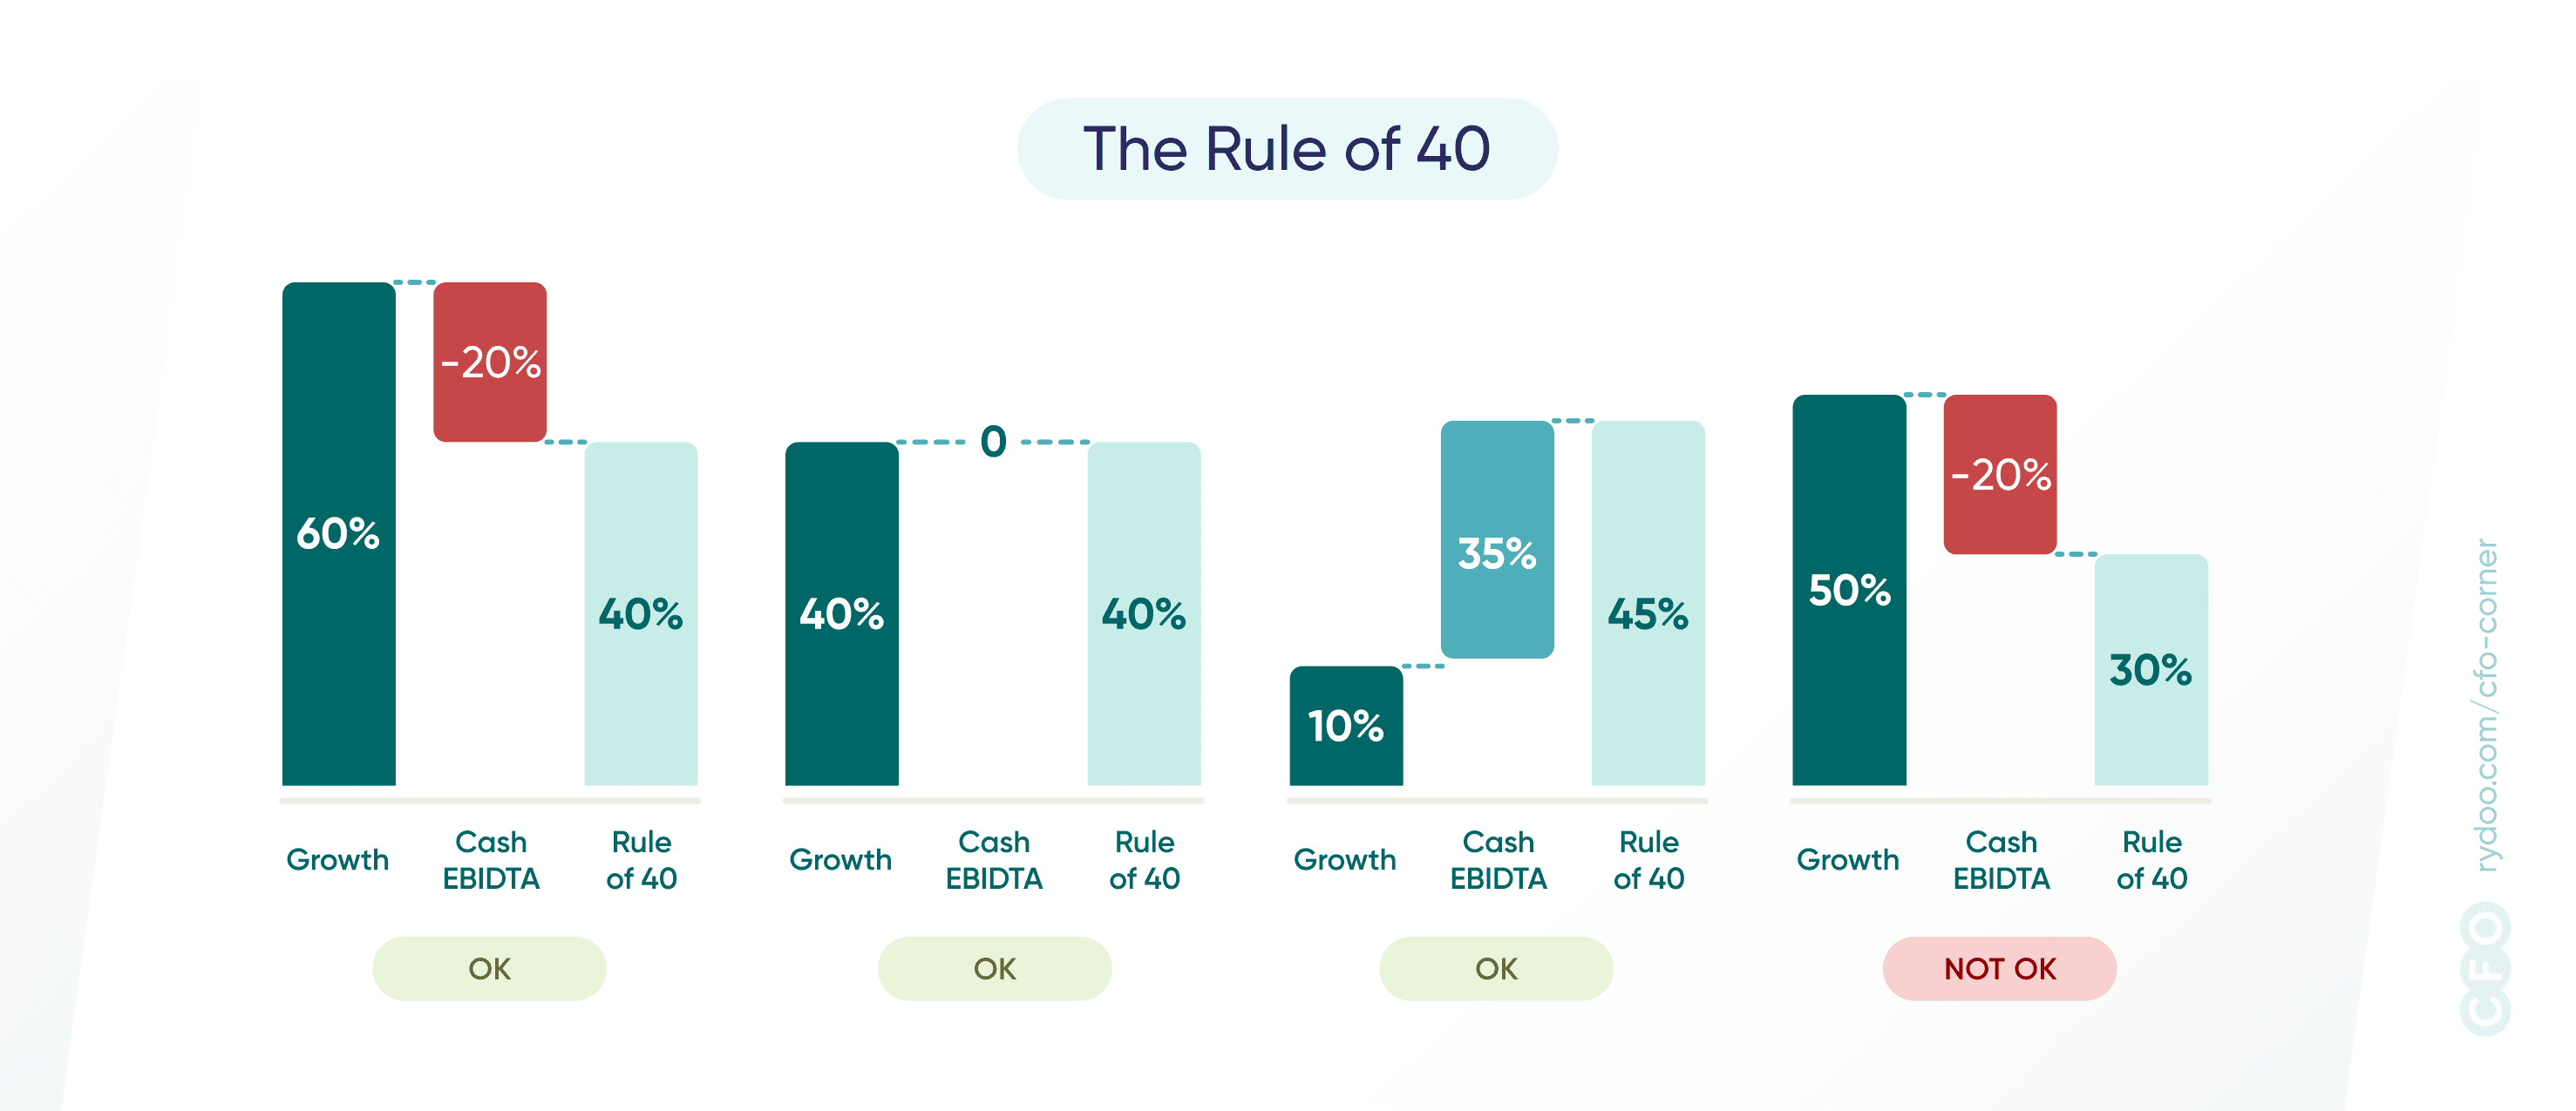
This rule helps balance growth and profitability, indicating that a healthy SaaS company should either be highly profitable, growing quickly, or both. Investors have used this rule over the last decade to evaluate whether a company is worth investing in. While it’s still a model most use, in today’s landscape, they are showing more interest in companies that continue to grow and maintain a profit beyond the Rule of 40.
Burn Multiple
Startups and growth-stage companies use the burn multiple to measure how efficiently they use their venture capital to generate Annual Recurring Revenue (ARR) growth. It’s calculated by dividing the net cash burn (total cash spent over a given period) by the net ARR added in a specific period.
This metric is important for understanding how effectively a company converts capital into revenue growth. It also helps leaders understand when and how much additional funding they may need while assisting in planning initiatives to optimise the use of capital for sustainable growth.
It’s a key number for investors, who see efficient capital use as a sign of a company’s long-term viability and profitability potential. A lower burn multiple indicates more efficient growth, suggesting that the company is on the right track to achieve financial independence, reducing its reliance on continuous external funding.